


Trusted by over 15 Million Traders
The Most Awarded Broker
for a Reason
Easy Access to 1,400+ Global Assets
EURUSD
Euro vs U.S. Dollar
US500
S&P 500 (US500)
GOLD
Gold
COFFEE
US Coffee
Apple
Apple (AAPL.OQ)
-

Finance Magnates 颁发
-

Finance Magnates 颁发
-

Capital Finance International Magazine (CFI.co) 2024年颁赠
-

COLWMA 2024年颁赠
-

荣获World Finance Forex Awards 2023最佳外汇客户服务奖
-

荣获World Finance Forex Awards 2023欧洲最佳外汇经纪商奖
-

荣获World Finance Forex Awards 2023澳大拉西亚最佳外汇经纪商奖
-

荣获World Finance Forex Awards 2023拉丁美洲最佳外汇经纪商奖
-

荣获World Finance Forex Awards 2023中东最佳外汇经纪商奖
-

CFI.co于2023年颁赠
-

荣获2023年City of London Wealth Management Awards
-

荣获2022年埃及金融博览会颁赠
-

荣获2022年City of London Wealth Management Awards
-

CFI.co于2022年颁赠
-

荣获Global Forex Awards 2022 — 零售外汇 颁赠
-
2021年迪拜外汇博览会获颁赠
-

Ultimate Fintech 2021年颁赠
-

荣获2021年City of London Wealth Management Awards
-

FX168于2020年12月颁赠
-

荣获Global Business Awards 2020
-

荣获2020年City of London Wealth Management Awards
-

Capital Finance International Magazine (CFI.co)颁赠
-

Capital Finance International Magazine (CFI.co)颁赠
-

荣获2019年City of London Wealth Management Awards
-

Shares Magazine 授予 UK Forex Awards 2018
-

Capital Finance International Magazine (CFI.co)颁赠
-

Capital Finance International Magazine (CFI.co)颁赠
-

2017年伦敦财富管理奖
-

2016最佳本土 客户服务
-

中东和北非地区(MENA)增长最快的经纪商
-
2015年最佳外汇科技提供商
-
2014年最佳外汇科技提供商
-

2014年最佳外汇科技提供商
-

荣获 The Trading Show 2024年非洲 Africa Fintech 峰会颁赠
-

荣获2024年中东地区 Brokersview 颁赠
-
荣获2024年中东地区 Brokersview 颁赠
-

荣获2024年阿曼 Smart Vision 峰会颁赠
-

荣获2024年迪拜外汇博览会颁赠
-

荣获2024年迪拜 Forex Traders Summit 颁赠
-

2024年埃及 Smart Vision 峰会颁赠
-

投查查于2024年颁赠
-

Capital Finance International Magazine (CFI.co) 2024年颁赠
-

CFI.co于2023年颁赠
-

CFI.co于2023年颁赠
-

交易社区平台FOLLOWME于2022年颁赠
-
2022年迪拜Forex Expo获颁赠
-
2022年迪拜Forex Expo获颁赠
-

荣获Global Forex Awards 2022 — 零售外汇 颁赠
-

CFI.co于2022年颁赠
-

CFI.co于2022年颁赠
-

World Finance Forex Awards 2022 颁发
-

World Finance Forex Awards 2022 颁发
-

World Finance Forex Awards 2022 颁发
-

World Finance Forex Awards 2022 颁发
-
交易社区平台FOLLOWME于2021年颁赠
-

2021年埃及Smart Vision Investment Expo博览会获颁赠
-

CFI.co于2021年颁赠
-

CFI.co于2021年颁赠
-

荣获Global Forex Awards 2021 — 零售外汇 颁赠
-

荣获Global Forex Awards 2021 — 零售外汇 颁赠
-

World Finance 2021颁发
-

World Finance 2021颁发
-
FOLLOWME于2021年颁赠
-

Global Forex Awards 2021 — B2B 颁赠
-

Global Forex Awards颁赠
-

Global Forex Awards颁赠
-

CFI.co于2020年颁赠
-

CFI.co于2020年颁赠
-

荣获Global Business Awards 2020
-

World Finance Magazine 颁赠
World Finance Forex Awards 2020 -

World Finance Magazine 颁赠
World Finance Forex Awards 2020 -
FOLLOWME交易社区授予
-

Global Forex Awards颁赠
-

Global Forex Awards颁赠
-

FinTech Age Awards颁发
-

World Finance Magazine 颁赠
World Finance Forex Awards 2019 -

World Finance Magazine 颁赠
World Finance Forex Awards 2019 -

荣获 World Finance Forex Awards 2018 颁赠
-

荣获2018年埃及金融博览会颁赠
-

荣获 Shares Magazine 的 UK Forex Awards 2017 颁赠
-

荣获 World Finance Forex Awards 2017
-

2016年最佳黄金经纪商
-

2016年最佳外汇经纪商
-

2015年最佳本地客户服务
-

Global Brands Magazine 颁赠
-

Online Money Awards 2022 颁发
-

荣获2022年埃及金融博览会颁赠
-

2015最佳外汇交易平台
-

2015最佳金融交易平台
-

2013最佳创新外汇平台奖
-

2020年 Cyprus HR Awards 颁赠
-

金融行业的佼佼者
-

认证最优金牌级别
-

2014年首届亚军
-
Finance Magnates 颁发
-
Finance Magnates 颁发
-
Capital Finance International Magazine (CFI.co) 2024年颁赠
-
COLWMA 2024年颁赠
-
荣获World Finance Forex Awards 2023最佳外汇客户服务奖
-
荣获World Finance Forex Awards 2023欧洲最佳外汇经纪商奖
-
荣获World Finance Forex Awards 2023澳大拉西亚最佳外汇经纪商奖
-
荣获World Finance Forex Awards 2023拉丁美洲最佳外汇经纪商奖
-
荣获World Finance Forex Awards 2023中东最佳外汇经纪商奖
-
CFI.co于2023年颁赠
-
荣获2023年City of London Wealth Management Awards
-
荣获2022年埃及金融博览会颁赠
-
荣获2022年City of London Wealth Management Awards
-
CFI.co于2022年颁赠
-
荣获Global Forex Awards 2022 — 零售外汇 颁赠
-
2021年迪拜外汇博览会获颁赠
-
Ultimate Fintech 2021年颁赠
-
荣获2021年City of London Wealth Management Awards
-
FX168于2020年12月颁赠
-
荣获Global Business Awards 2020
-
荣获2020年City of London Wealth Management Awards
-
Capital Finance International Magazine (CFI.co)颁赠
-
Capital Finance International Magazine (CFI.co)颁赠
-
荣获2019年City of London Wealth Management Awards
-
Shares Magazine 授予 UK Forex Awards 2018
-
Capital Finance International Magazine (CFI.co)颁赠
-
Capital Finance International Magazine (CFI.co)颁赠
-
2017年伦敦财富管理奖
-
2016最佳本土 客户服务
-
中东和北非地区(MENA)增长最快的经纪商
-
2015年最佳外汇科技提供商
-
2014年最佳外汇科技提供商
-
2014年最佳外汇科技提供商
-
荣获 The Trading Show 2024年非洲 Africa Fintech 峰会颁赠
-
荣获2024年中东地区 Brokersview 颁赠
-
荣获2024年中东地区 Brokersview 颁赠
-
荣获2024年阿曼 Smart Vision 峰会颁赠
-
荣获2024年迪拜外汇博览会颁赠
-
荣获2024年迪拜 Forex Traders Summit 颁赠
-
2024年埃及 Smart Vision 峰会颁赠
-
投查查于2024年颁赠
-
Capital Finance International Magazine (CFI.co) 2024年颁赠
-
CFI.co于2023年颁赠
-
CFI.co于2023年颁赠
-
交易社区平台FOLLOWME于2022年颁赠
-
2022年迪拜Forex Expo获颁赠
-
2022年迪拜Forex Expo获颁赠
-
荣获Global Forex Awards 2022 — 零售外汇 颁赠
-
CFI.co于2022年颁赠
-
CFI.co于2022年颁赠
-
World Finance Forex Awards 2022 颁发
-
World Finance Forex Awards 2022 颁发
-
World Finance Forex Awards 2022 颁发
-
World Finance Forex Awards 2022 颁发
-
交易社区平台FOLLOWME于2021年颁赠
-
2021年埃及Smart Vision Investment Expo博览会获颁赠
-
CFI.co于2021年颁赠
-
CFI.co于2021年颁赠
-
荣获Global Forex Awards 2021 — 零售外汇 颁赠
-
荣获Global Forex Awards 2021 — 零售外汇 颁赠
-
World Finance 2021颁发
-
World Finance 2021颁发
-
FOLLOWME于2021年颁赠
-
Global Forex Awards 2021 — B2B 颁赠
-
Global Forex Awards颁赠
-
Global Forex Awards颁赠
-
CFI.co于2020年颁赠
-
CFI.co于2020年颁赠
-
荣获Global Business Awards 2020
-
World Finance Magazine 颁赠
World Finance Forex Awards 2020 -
World Finance Magazine 颁赠
World Finance Forex Awards 2020 -
FOLLOWME交易社区授予
-
Global Forex Awards颁赠
-
Global Forex Awards颁赠
-
FinTech Age Awards颁发
-
World Finance Magazine 颁赠
World Finance Forex Awards 2019 -
World Finance Magazine 颁赠
World Finance Forex Awards 2019 -
荣获 World Finance Forex Awards 2018 颁赠
-
荣获2018年埃及金融博览会颁赠
-
荣获 Shares Magazine 的 UK Forex Awards 2017 颁赠
-
荣获 World Finance Forex Awards 2017
-
2016年最佳黄金经纪商
-
2016年最佳外汇经纪商
-
2015年最佳本地客户服务
-
Global Brands Magazine 颁赠
-
Online Money Awards 2022 颁发
-
荣获2022年埃及金融博览会颁赠
-
2015最佳外汇交易平台
-
2015最佳金融交易平台
-
2013最佳创新外汇平台奖
-
2020年 Cyprus HR Awards 颁赠
-
金融行业的佼佼者
-
认证最优金牌级别
-
2014年首届亚军

Awarded BestBrokerYear After Year
CATEGORIES
News
- 【XM Forex】--ETH/USD Forecast: Ethereum Awaits Momentum
- 【XM Market Review】--S&P 500 Monthly Forecast: December 2024
- 【XM Market Review】--USD/CHF Forecast: Pulls Back to Key Support
- 【XM Market Analysis】--ETH/USD Forecast: Holds 50 Day EMA
- 【XM Market Analysis】--BTC/USD Forex Signal: Risky Pattern Points to a Potential
market news
Eagle and bear share Ukraine, with gold and silver empty after the Yin and Yang
Wonderful introduction:
Since ancient times, there have been joys and sorrows, and since ancient times, there have been sorrowful moon and songs. But we never understood it, and we thought everything was just a distant memory. Because there is no real experience, there is no deep feeling in the heart.
Hello everyone, today XM Foreign Exchange will bring you "[XM Official Website]: Eagle and Bear share Ukraine, and the Yin and the Yang are covered with gold and silver are empty." Hope it will be helpful to you! The original content is as follows:
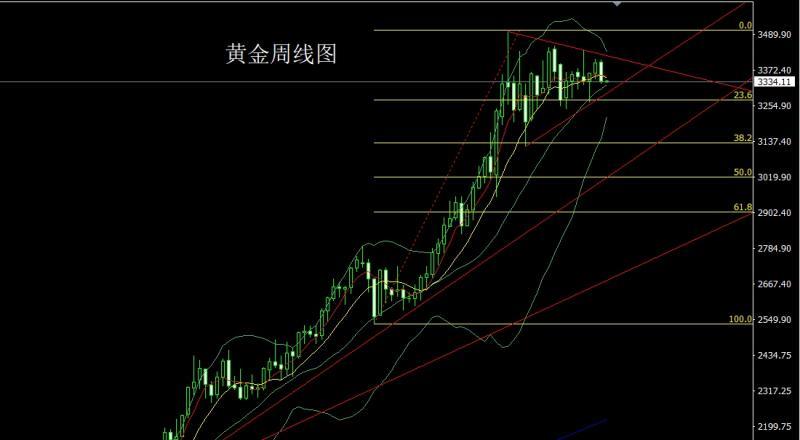
Last week, the gold market opened slightly higher at the beginning of the week and then rose slightly. After the market rose slightly, the market fell sharply. At the lowest point of the weekly line on Thursday, the market fluctuated in the low range. The weekly line finally closed at the 3335.8 position and the market closed with a large negative line with an upper shadow line slightly longer than the lower shadow line. After this pattern ended, the weekly line was negative and covered with positive lines. This week's market fell back short. At the point, 3340 short stop loss of 3345 today, 3329, and 3318 and 3312-3304 below. If it breaks, 3292 and 3286 and 3280 support to leave the market.
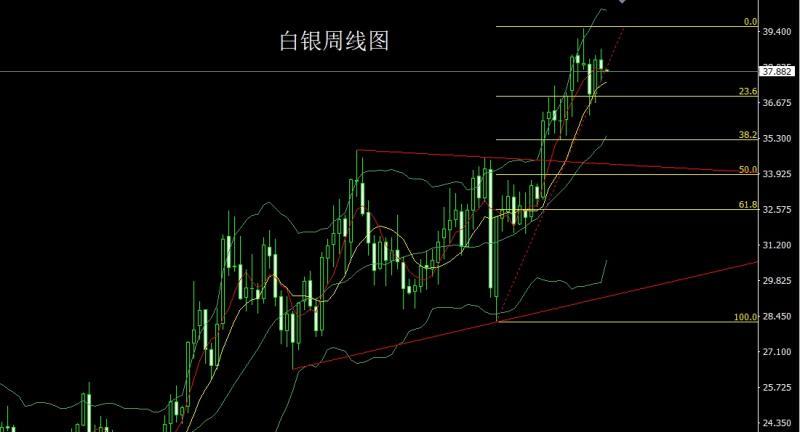
The silver market opened at 38.327 last week and then fell strongly. The weekly line was at 37.488 at the lowest point and the market rose strongly during the session. The weekly line reached the highest point of 38.733 and then fell back under fundamental pressure. The weekly line finally closed at 37.986 and then closed in a spindle pattern with a lower shadow slightly longer than the upper shadow. After this pattern ended, the short stop loss of 38.5 this week at 38.3, the target below is 37.85 and 37.6, and the support below is 37.5 and 37.3-37.1.
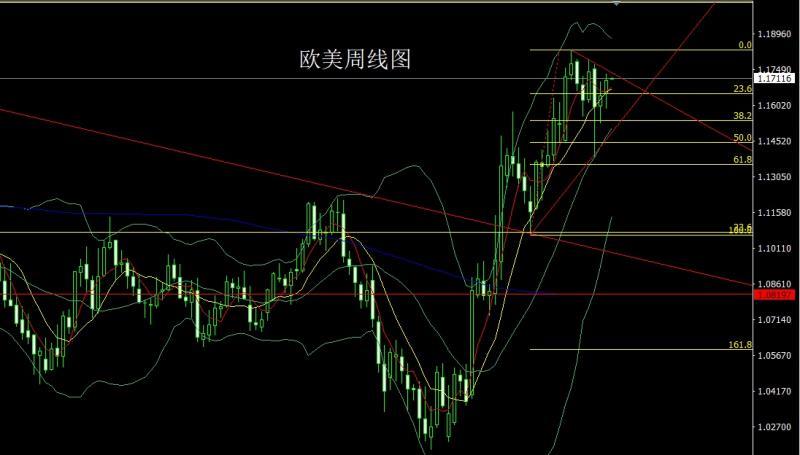
European and American markets opened slightly higher at 1.16483 last week and the market fell first. The weekly line was at the lowest point of 1.15884 and the market fluctuated and rose. The weekly line reached the highest point of 1.17309 and then the market fluctuated strongly in the range. The weekly line finally closed at 1.17024 and then the market closed with a medium-positive line with a long lower shadow line. After this pattern ended, the stop loss of more than 1.16750 this week was 1.16550, and the target was 1.17100 and 1.17300 and 1.17600-1.17800.
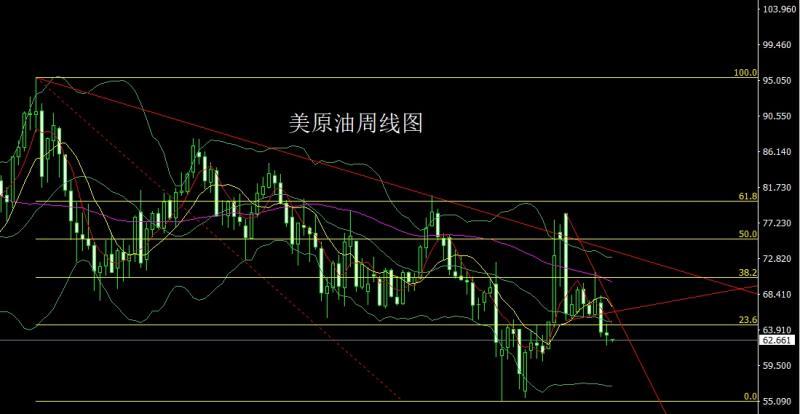
The U.S. crude oil market opened at 63.58 last week and then the market first rose to 64.7, and then the market fell under pressure. The weekly line was at the lowest point of 62.06 and then the market fluctuated and rose. After the weekly line finally closed at 63.26, the weekly line closed with a long-leg cross star with an upper and lower shadow line equal to the length. After this pattern ended, the short stop loss of 64 this week, 63.5 fell below 62.5 and 62, and fell below 61.6 and 61.4.
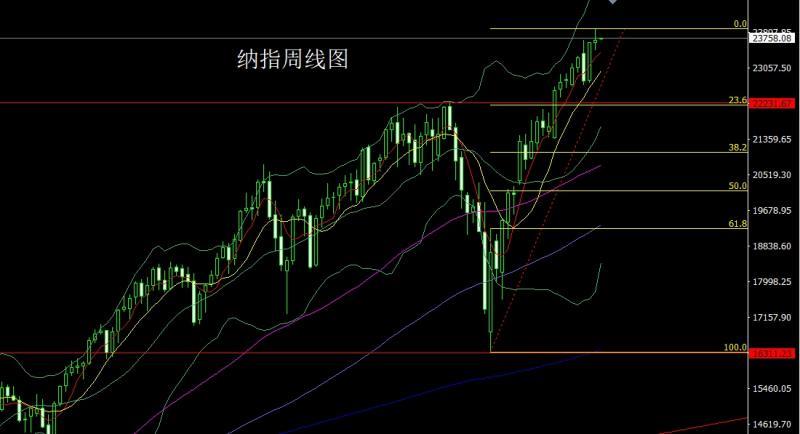
The Nasdaq market opened at 23653.75 last week and the market fell first. The weekly line was at the lowest point of 23478.73 and then rose strongly. The weekly line reached the highest point of 23967.88 and then consolidated. After the weekly line finally closed at 23706.11, the weekly line closed in a spindle pattern with an upper shadow line longer than the lower shadow line. After this pattern ended, there was still pressure to fall this week. , At the point, the short position of 23860 last Friday followed by the stop loss at 23900. Today, the short position of 23850 is below 23900. The target below 23650 is 23600, and the falling below 23600 and 23550-23500.
The fundamentals, the fundamental market data were frequently reported in the past week. The data showed that the US CPI inflation rose only moderately in July, and the expectation of interest rate cuts in September heated up. The US index began to continue to fall and fell below the 98 mark. Subsequently, due to higher than expected PPI in July, which may suggest a rebound in future inflation, the US dollar index once returned to above the 98 mark, but closed at 97.82 below it on Friday, closing lower for the second consecutive week. Against this backdrop of data conflict, gold, silver and non-US currency markets continued the range consolidation process. They negotiated in Alaska on the weekend. After the meeting, the US President said that he and Putin did not reach an agreement on "probably the most important aspect" during the meeting, but there is a great possibility of reaching an agreement, giving the meeting 10 points and meeting with Putin is expected to soon. Putin said the talks were constructive and we had a very good direct connection with the US president. All root causes must be eliminated and all Russian concerns must be considered. The next meeting with the US president may be in Moscow. Although the negotiations failed to reach any agreement,It is obvious that the next condition for the US president to have to end the Ukrainian president is the key to ending the conflict between Russia and Ukraine. As of now, without the support of the United States, it is unrealistic for Ukraine to rely on EU countries that have been hollowed out. After three years of fighting, Russia has obtained land and the United States has obtained minerals to attack the EU. The weakening of the strength of the EU has indeed been achieved, but Ukraine seems to be no different from the country being destroyed. The fundamentals of this week are mainly focused on Ukrainian President Zelensky meeting with the US president in Washington today. At 22:00 pm, follow the NAHB real estate market index in August. On Tuesday, we focused on the annualized total number of new homes started in the United States in July and the total number of construction permits in the United States in July. On Wednesday, we will pay attention to the final value of the CPI annual rate of the euro zone in July at 17:00. The U.S. market looked at the EIA crude oil inventories in the week from 22:30 to August 15, and the EIA crude oil inventories in the week from 22:30 to the week from August 15, and the EIA strategic oil reserve inventories in the week from August 15. On Thursday, the Federal Reserve announced the minutes of the monetary policy meeting at 2:00 a.m. In the evening, we will see the number of initial unemployment claims in the United States to August 16 and the US Philadelphia Fed Manufacturing Index for August from 20:30. This round is expected to be 226,000 people. Look at the initial value of S&P Global Manufacturing PMI in August at 21:45 later and the initial value of S&P Global Services PMI in August in the United States. Look later at the initial value of the Eurozone August Consumer Confidence Index and the annualized total number of existing home sales in the United States in July and the monthly rate of the U.S. Chamber of xmtraders.commerce leading indicators in July. Friday is the key to the week, focusing on 22:00 Fed Chairman Powell delivered a speech at Jackson Hall Global Central Bank Annual Meeting. Against the backdrop of the US president's desire to replace the Federal Reserve's chairman and strongly demanding a significant rate cut, and the upcoming start of the Federal Reserve's interest rate cut in September, the content of this speech needs to be paid attention to.
In terms of operation, gold: 3340 short stop loss 3345 today, look at 3329 below, if the target falls below, look at 3324 and 3318 and 3312-3304 below, look at 3292 and 3286 and 3280 support to leave the market, prepare for a long time.
Silver: Short stop loss at 38.5 this week, 38.3, 38.5, and 37.6, and 37.5, and 37.3-37.1 support below.
Europe and the United States: 1.16750 more than 1.16550 this week, with a target of 1.17100 and 1.17300 and 1.17600-1.17800.
U.S. crude oil: 63.5 short stop loss this week, 64, 62.5 and 62, 61.6 and 61.4.
Nasdaq: 23860 short stop loss last Friday The stop loss after position is followed at 23900. Today, the target below 23850 short stop loss is 23900. The target below the 23650 is 23600 and 23550-23500.
The above content is all about "[XM official website]: Eagle and bear share Ukraine, Yin and Yang are consuming gold and silver are empty". It is carefully xmtraders.compiled and edited by the editor of XM Forex. I hope it will be helpful to your trading! feelThank you for your support!
Due to the author's limited ability and time constraints, some content in the article still needs to be discussed and studied in depth. Therefore, in the future, the author will conduct extended research and discussion on the following issues:
Disclaimers: XM Group only provides execution services and access permissions for online trading platforms, and allows individuals to view and/or use the website or the content provided on the website, but has no intention of making any changes or extensions, nor will it change or extend its services and access permissions. All access and usage permissions will be subject to the following terms and conditions: (i) Terms and conditions; (ii) Risk warning; And (iii) a complete disclaimer. Please note that all information provided on the website is for general informational purposes only. In addition, the content of all XM online trading platforms does not constitute, and cannot be used for any unauthorized financial market trading invitations and/or invitations. Financial market transactions pose significant risks to your investment capital.
All materials published on online trading platforms are only intended for educational/informational purposes and do not include or should be considered for financial, investment tax, or trading related consulting and advice, or transaction price records, or any financial product or non invitation related trading offers or invitations.
All content provided by XM and third-party suppliers on this website, including opinions, news, research, analysis, prices, other information, and third-party website links, remains unchanged and is provided as general market commentary rather than investment advice. All materials published on online trading platforms are only for educational/informational purposes and do not include or should be considered as applicable to financial, investment tax, or trading related advice and recommendations, or transaction price records, or any financial product or non invitation related financial offers or invitations. Please ensure that you have read and fully understood the information on XM's non independent investment research tips and risk warnings. For more details, please click here